 English
 Română
 Nederlands
Key Performance Indicators
To assess the severity of the flooding conditions, this web application uses a set of Key Performance Indicators (KPIs) related to the flood hazard. Flood hazards can be assessed by multiple factors, such as: flood return period, flood extent, flood depth, flood velocity, time duration of flooding, and others. These factors can be used to assess potential harm to people, agriculture and infrastructure. All such assets have certain flood vulnerability, which, if quantified, can be combined with flood hazard data to provide different levels of flood risk. Here we do not have such quantification, so we focus on different flood hazard KPIs, which for visual inspections can be combined with a spatial representation of key assets that may be exposed to flooding (we name this spatial representation 'Vulnerable areas').
Sometimes, a combination of flood hazard factors can be used to provide Composite flood hazard. Here we used a methodology from Australia that combines flood depth and flood velocity to provide a KPI that results in different categories of composite flood hazard.
The figure on the right summarizes the Flood hazard and Composite Flood hazard KPIs. You can use the tabs below to explore the values of these KPIs for the flood of the summer 2016.
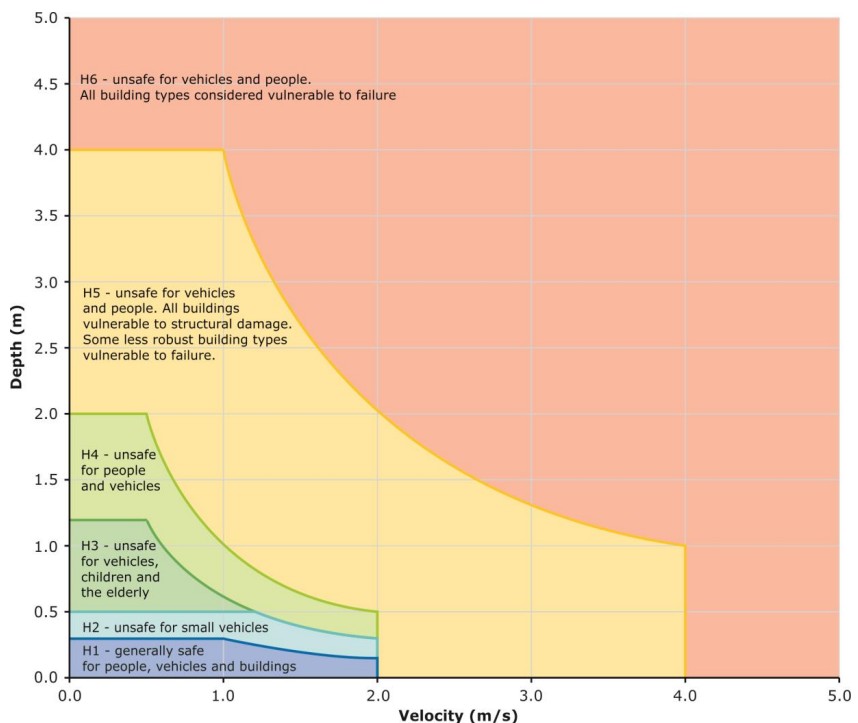
Click image to view composite hazard curves
Flood Hazard
Composite Flood Hazard
Select below a flood hazard KPI.
Select below composite flood hazard KPI (flood of 2016) in relation to different vulnerable areas.