 English
 Română
 Nederlands
Adaptation Strategies
This section provides information about the adaptation strategies used in the Climate Adaptation Smart Solution in terms of the flood hazard KPIs. There are two separate strategies for adaptation, one using an existing structural storage area, just upstream of the modelled area, and one Nature-based Solutions (NbS) as a wetland development in the area of Birda. A third strategy shows the combination of the two strategies.
Adaptation Strategies
Click on each strategy below to learn more about the measures implemented.
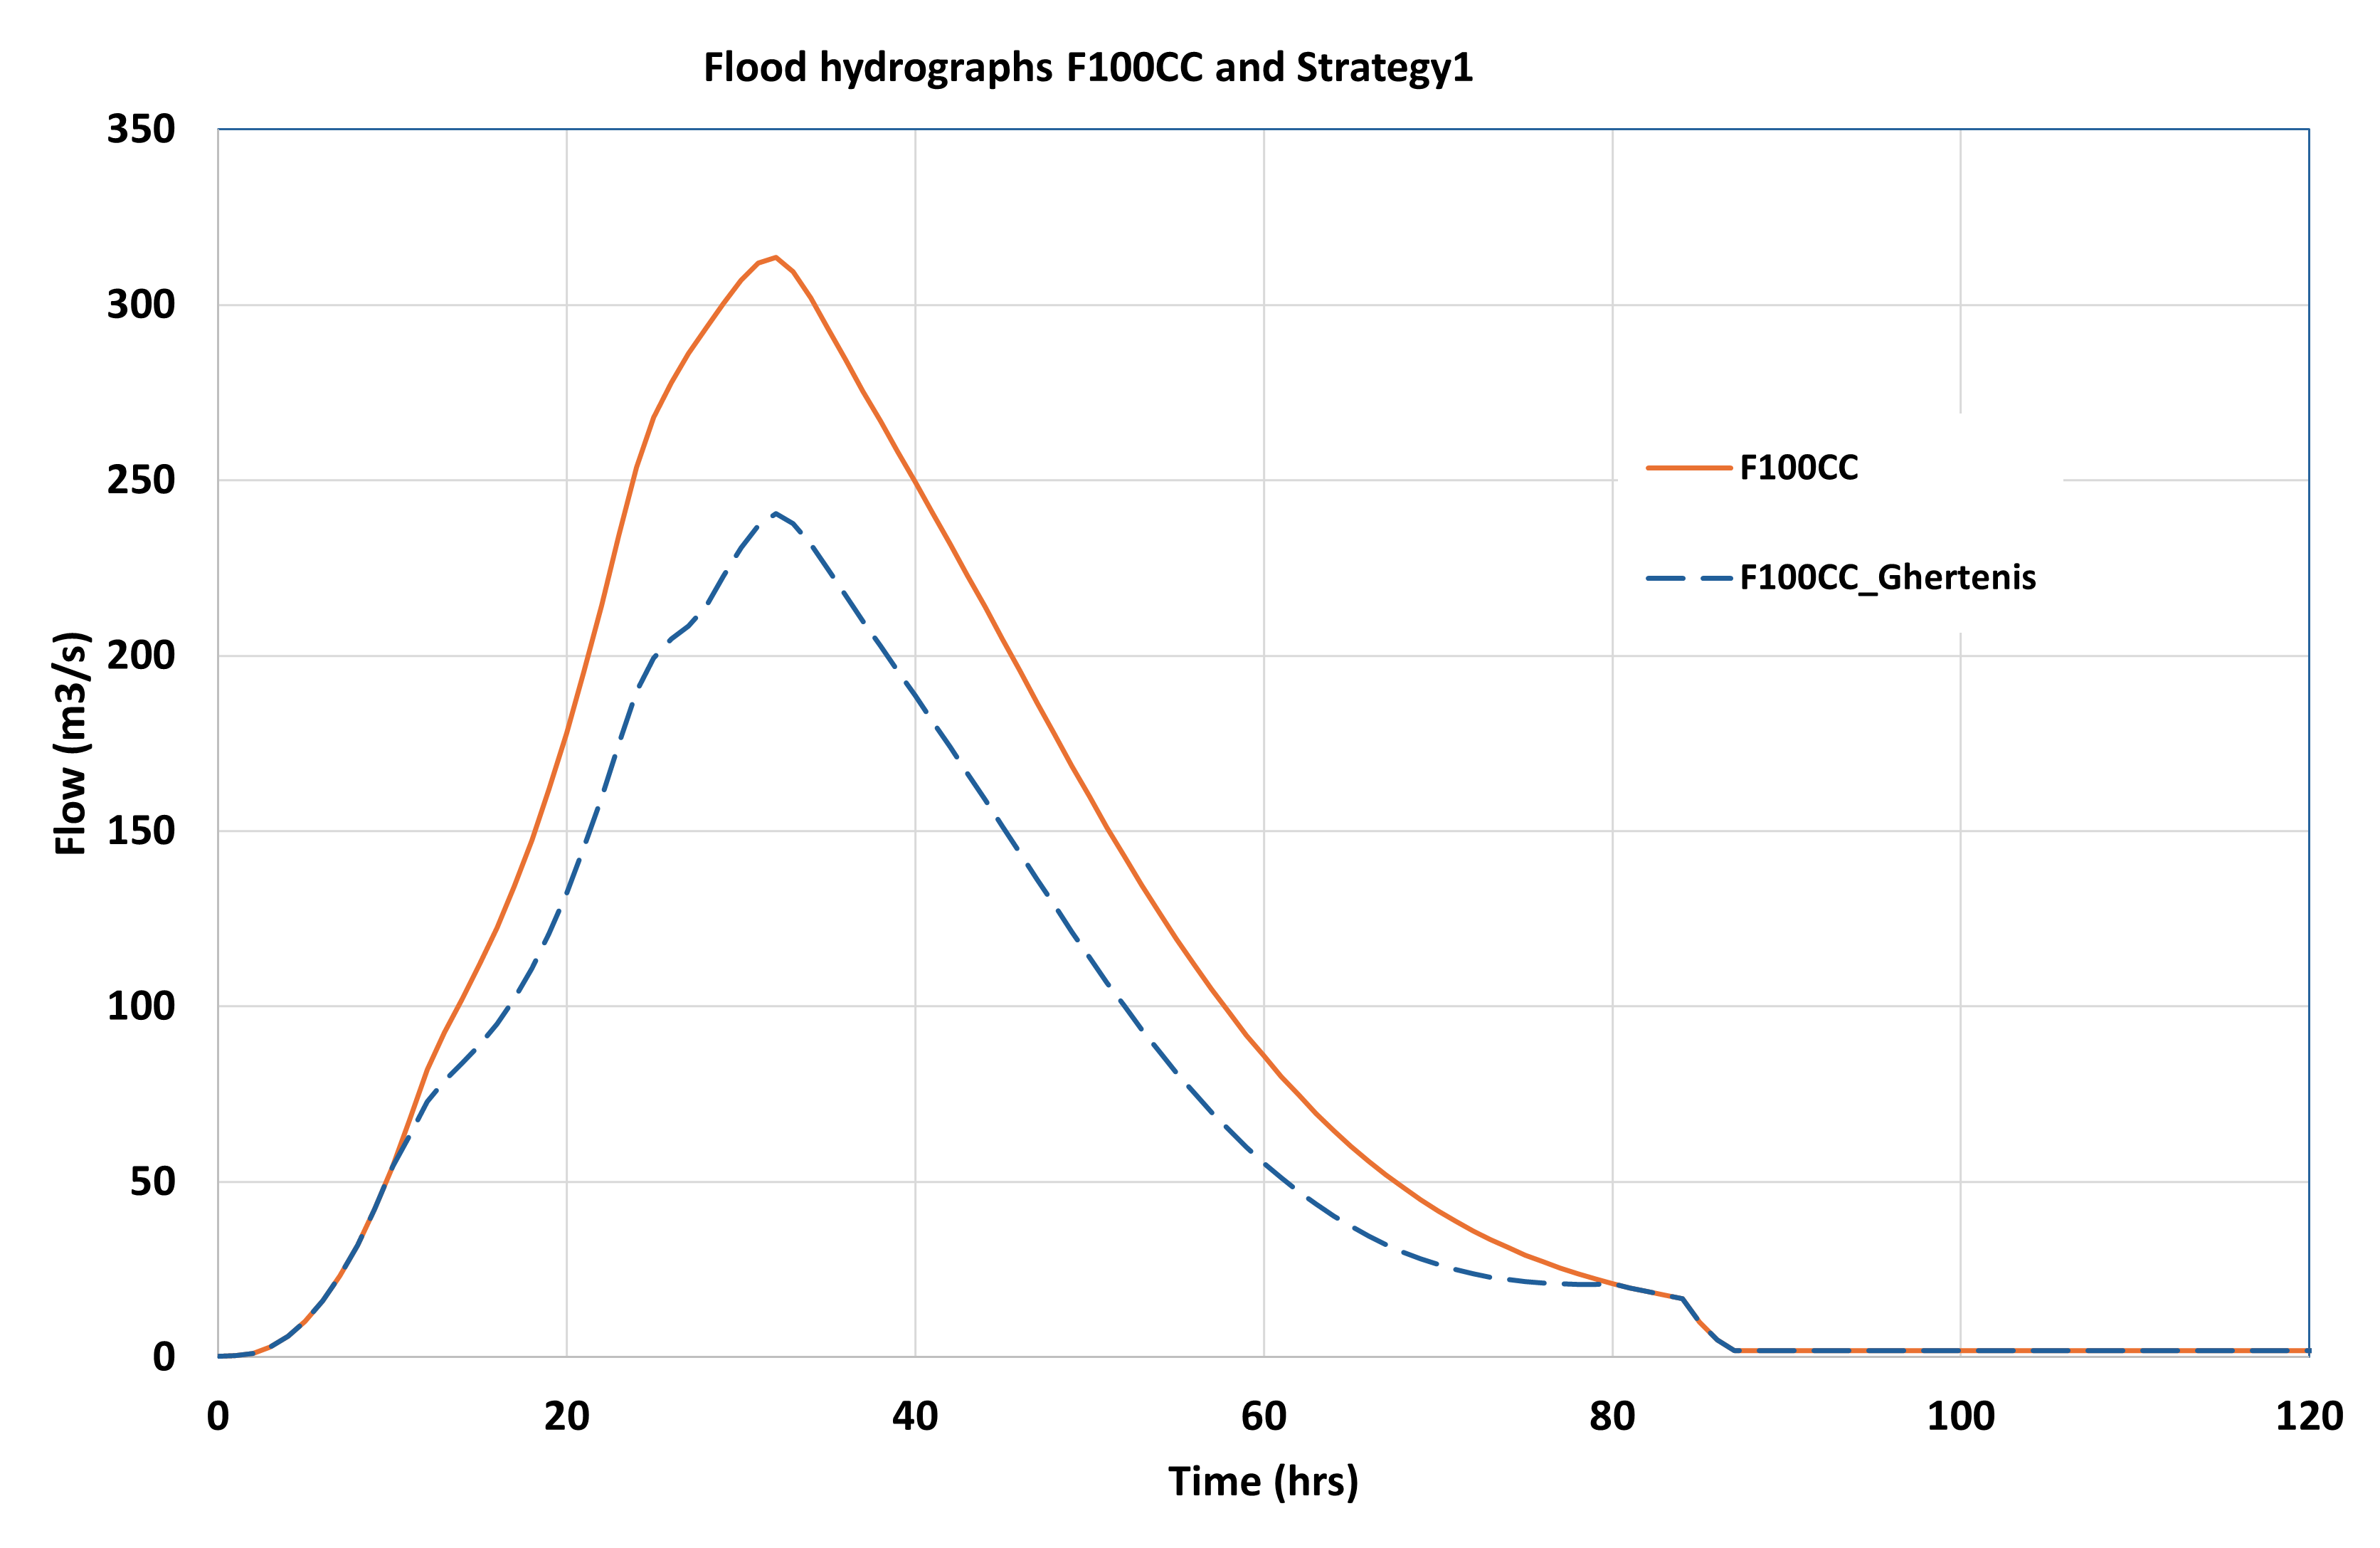
▶ Strategy 1: retain part of hydrograph in the Ghertenis storage area
In this strategy the hydrograph reaching the upstream boundary condition point is reduced due to the use of the Ghertenis flood storage area, which is designed to temporarily retain part of the flood volume, approx 10Mil m3) before it reaches Gataia. The stored water will be released gradually after the flood peak has passed. The initial and the attenuated hydrographs are illustrated in the figure on the right.
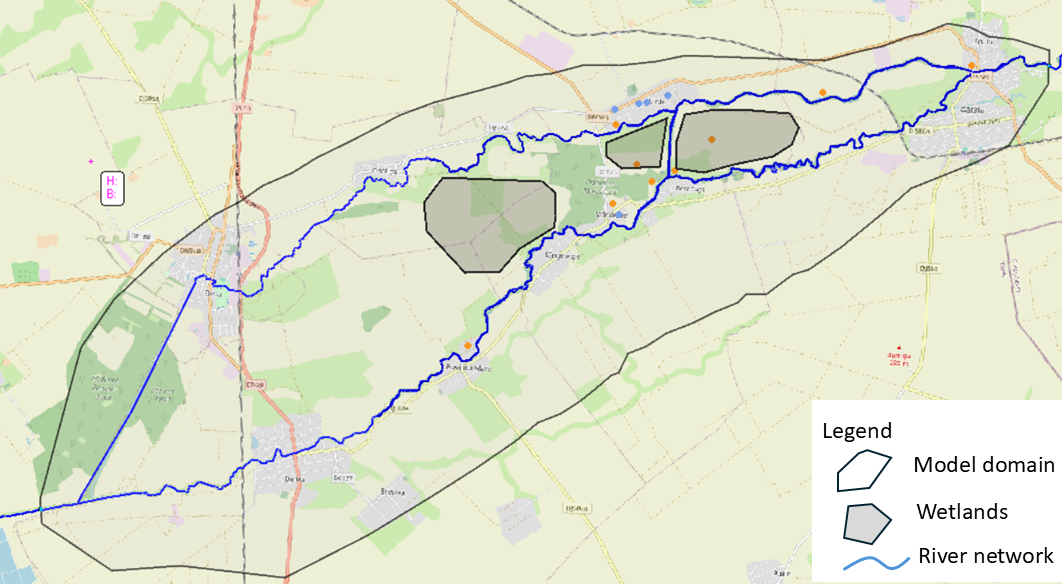
▶ Strategy 2: use wetlands as nature based solutions
This option considers the possibility of building or restoring wetlands within the study area. Wetlands act as natural buffering zones that slow down runoff and temporarily store water during rainfall or flood events. Their vegetation, topography, and permeable soils increase surface roughness and allow infiltration, which reduces runoff velocities and water is extended over a larger area. As a result, wetlands help mitigate the overall flood impact in the study area. The overall area of the considered wetlands is 8 km2. The figure on the right illustrates where wetlands were considered in the model.
▶ Strategy 3: Combine strategy S1&S2
The third strategy considers a combined implementation of Strategy 1 and Strategy 2, integrating upstream flood storage with the development of wetlands in the considered area to enhance overall flood mitigation.
Pairwise Scenario Comparison
This interactive tool allows you to perform pairwise comparison of the effectiveness of different adaptation strategies considering the selected Key Performance Indicators (KPI). Select a pair of strategies from the dropdown boxes on the left and a KPI from the dropdown box on the right.