English
 Română
 Nederlands
Coupled groundwater (GW) and surface water (SW) model
Adapting to water periods requires knowledge on how water moves through a landscape. Because it is not possible to measure these processes everywhere in space, hydrological models can be used to trace how a drop of rain travels once it reaches the ground, showing how water flows across fields, infiltrates into the soil, or moves through rivers and groundwater.
By combining data on climate and landscape characteristics, such as rainfall, soil, land use, and topography, a hydrological model helps us understand how the water system works and how it responds to changes. It also allows us to test and evaluate climate adaptation strategies before implementation.
For the Handzamevaart catchment, a hydrological model was built using MIKE SHE modelling system to understand how water flows across the landscape throughout the years. By combining data of the local climate and the existing landscape, it is possible to explore how the Handzamevallei responds to both wet and dry conditions and how Nature-based Solutions (NbS) could help reduce floods and/or alleviate the impacts of drought. The Handzamevaart model is divided into small grid cells of 100 × 100 metres, allowing local differences in soil, slope, and land use to be represented in detail.
This Smart Solution focuses on the performance of nature-based strategies under current climate (2010–2019), including a range of observed wet and dry conditions in the valley. Future climate scenarios were not included to avoid adding uncertainty to the outcomes. If you’re interested in future climate projections for Flanders, you can explore them in the Flemish Climate Portal.
Explore the model inputs and results through the interactive map below.
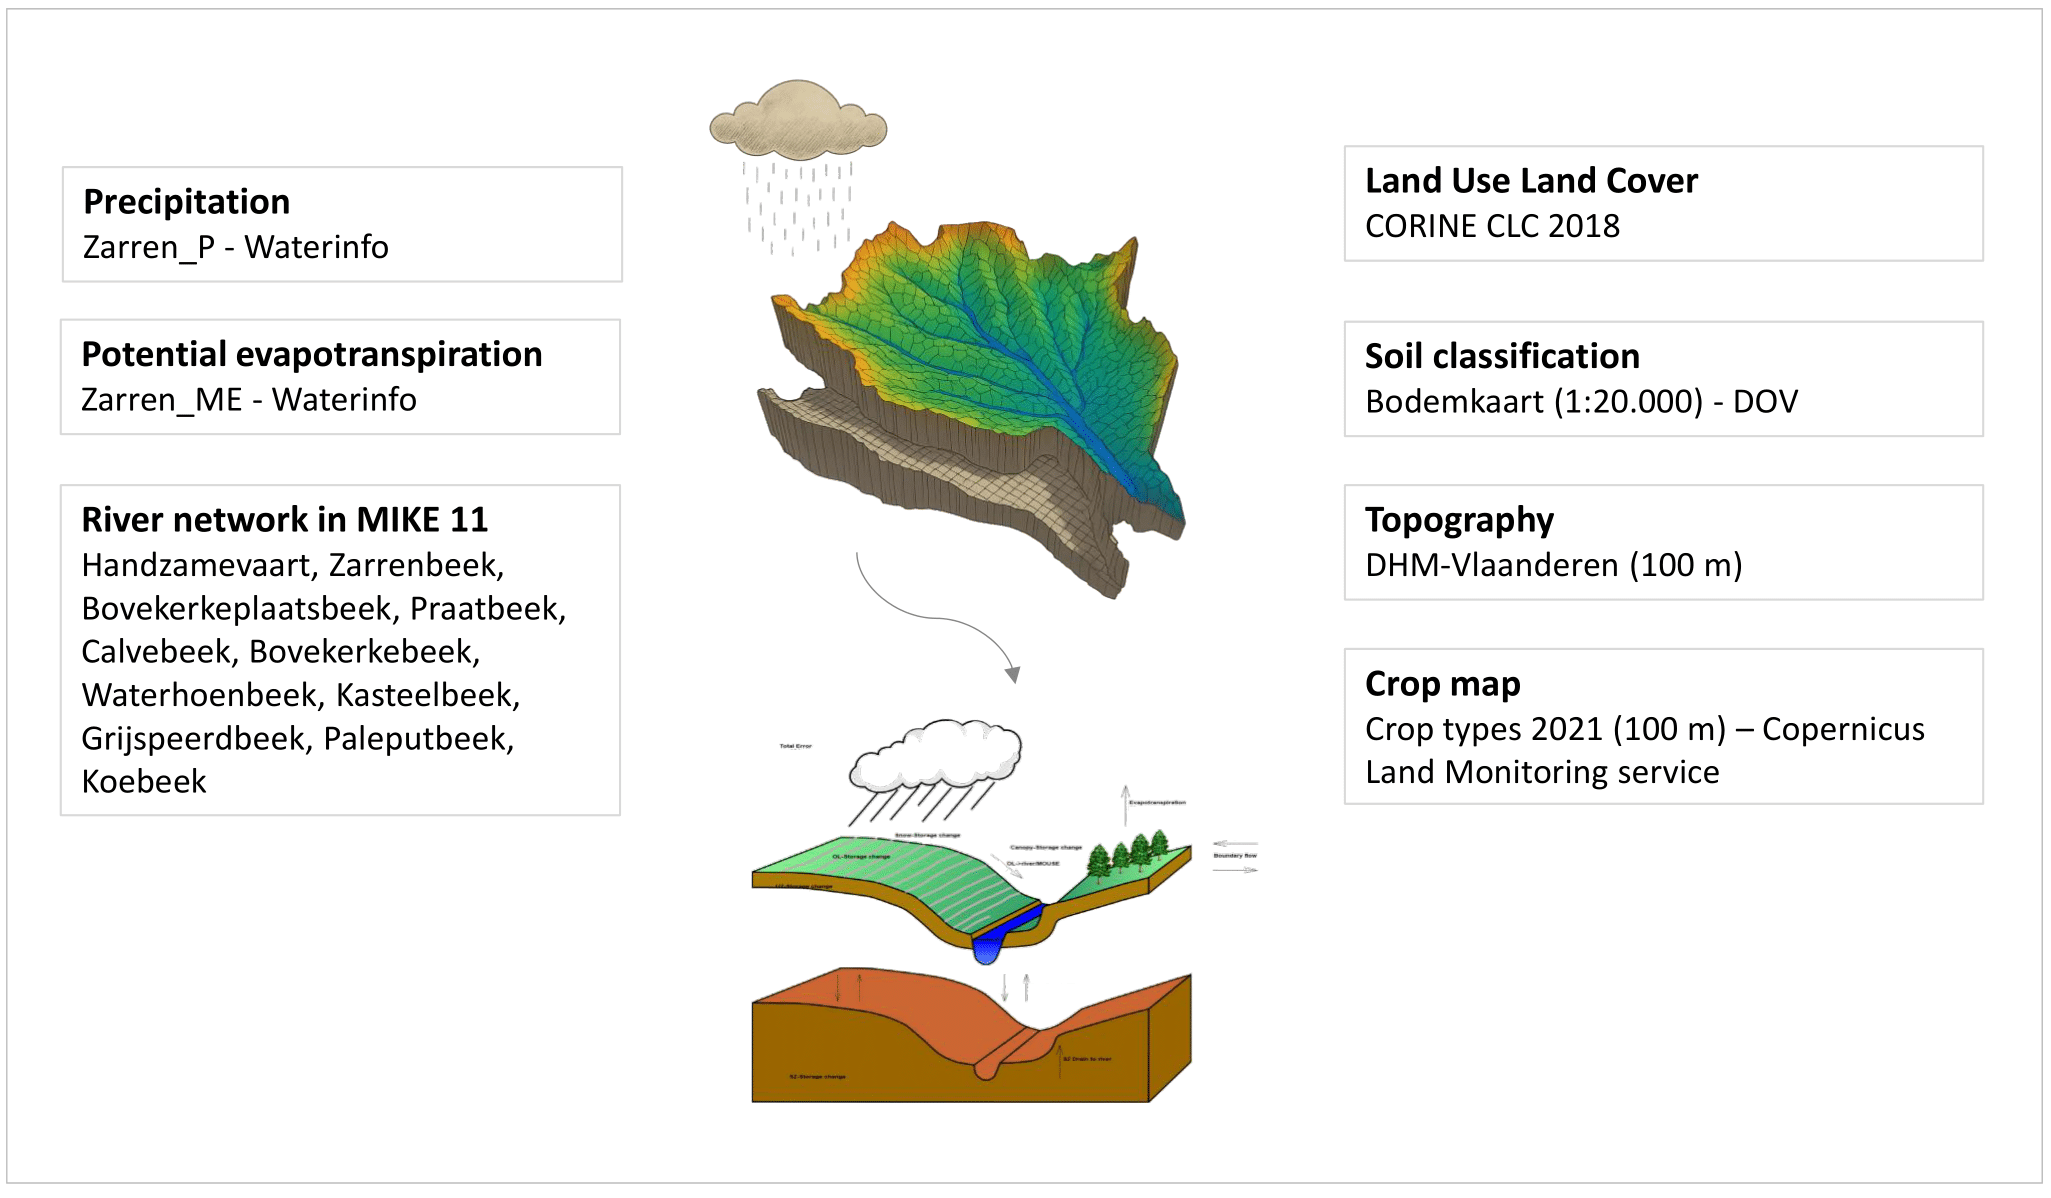
Figure 1. Summary of the Handzamevaart catchment model setup in MIKE SHE.
Model inputs and results
Map Layers
Model Calibration and Validation ▼ Expand
Model calibration and validation are essential processes in ensuring the reliability and accuracy of a model. The calibration process involves adjusting model parameters to minimize the difference between simulated and observed data, while validation tests the model's predictive capability using independent datasets not used during calibration.
For the Handzamevaart catchment model, calibration focuses on matching historical observations of river discharges, river water levels, and groundwater levels. The main parameters adjusted for model calibration were: (i) drainage distribution, (ii) drainage time constant, and (iii) saturated hydraulic conductivity. The validation process confirms the model's ability to accurately represent hydrological processes and predict system responses under various conditions, building confidence in its use for climate adaptation scenario analysis.
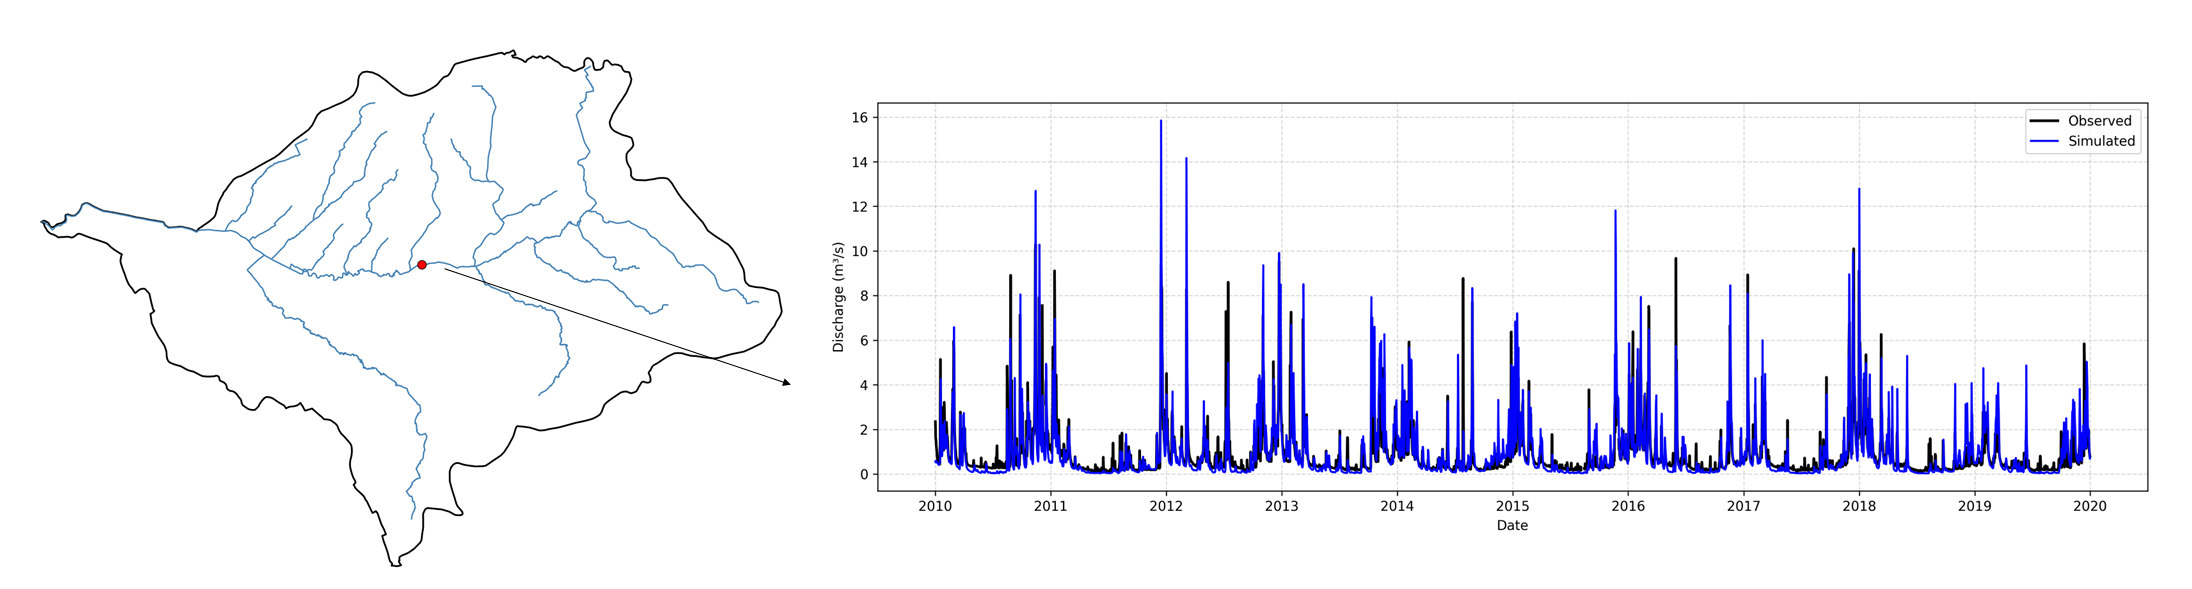
Simulated vs observed river discharge at Kortemark station
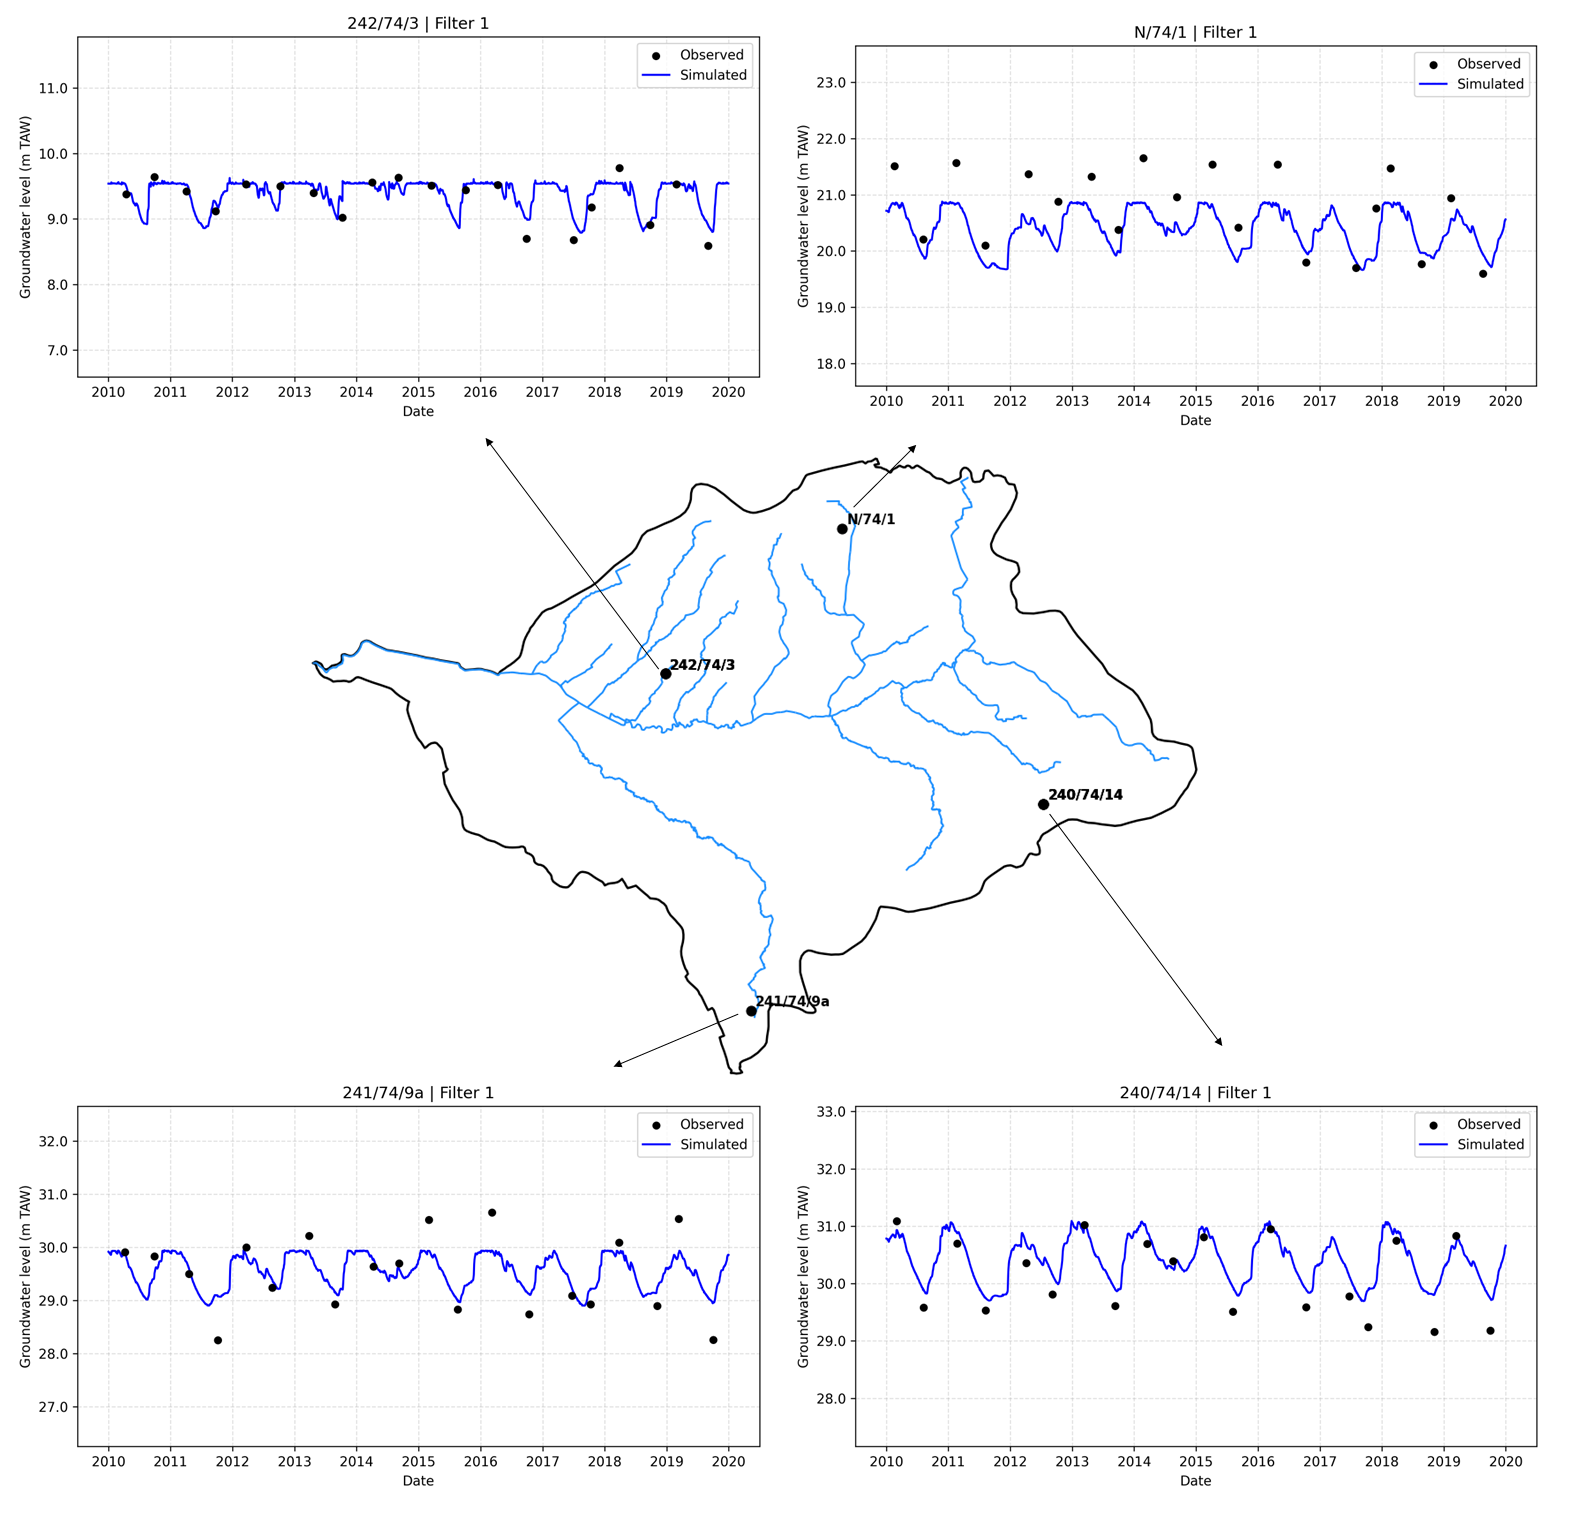
Simulated vs observed groundwater levels at four selected locations
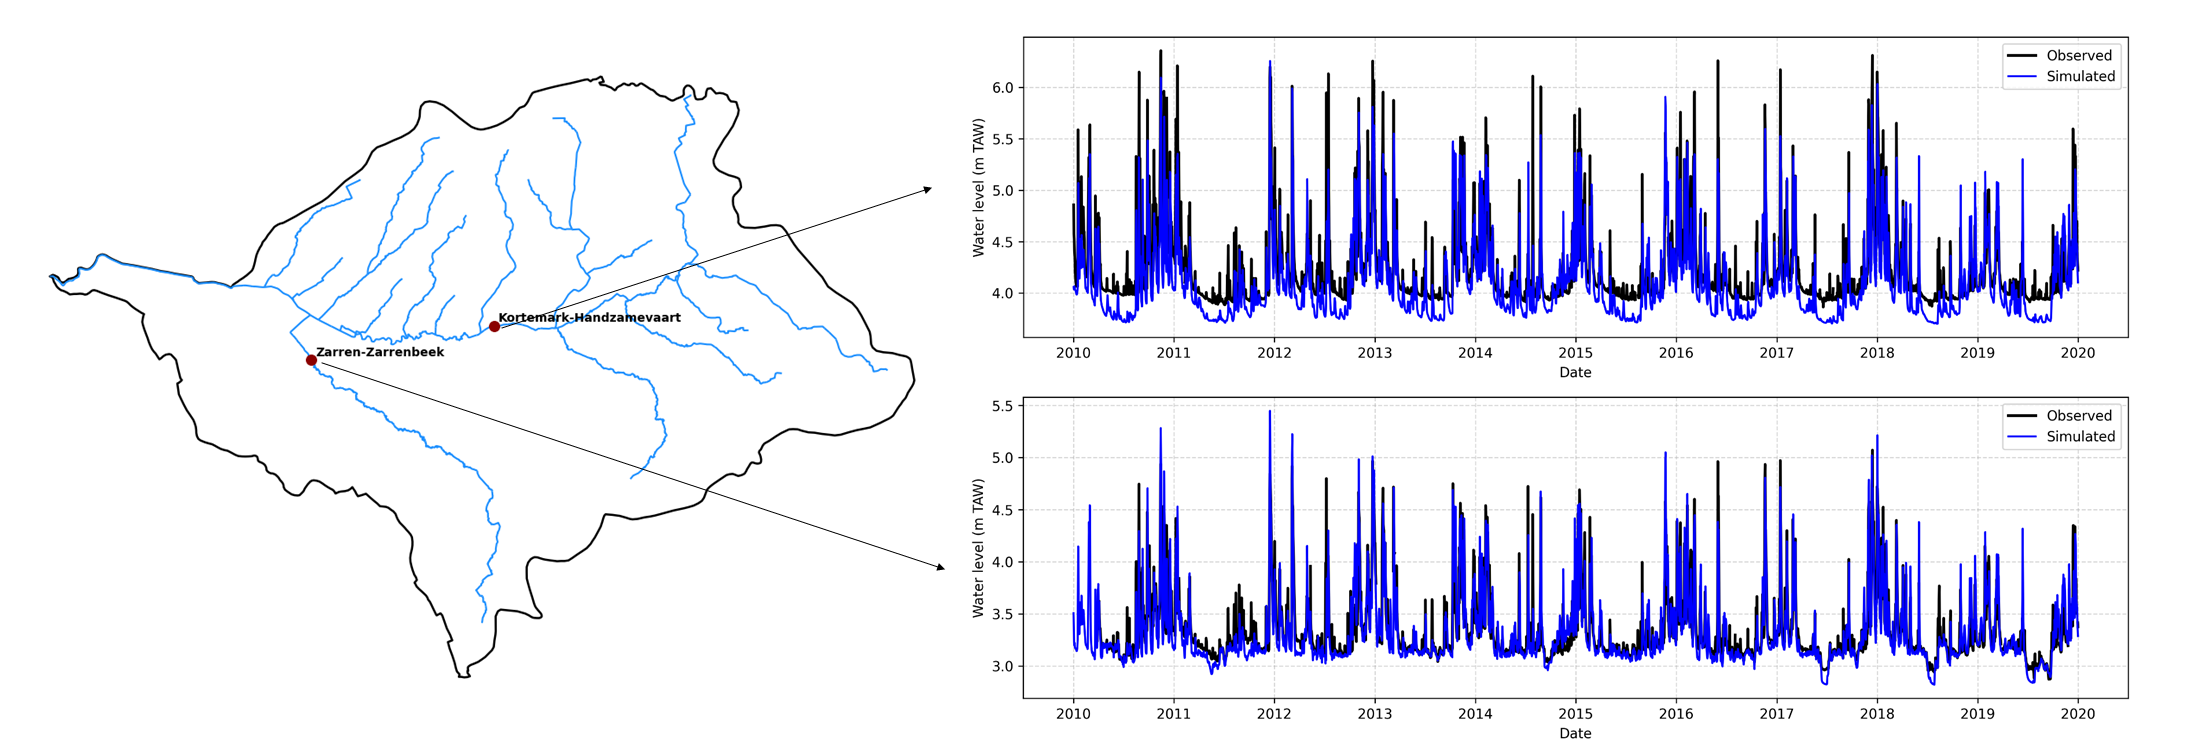
Simulated versus observed water level at two locations