 English
 Română
 Nederlands
Current and Future Flood Patterns
For flood analysis hydrologists often use so-called 'design flood hydrographs'. These are temporal variations of flow (river discharge) during the flood event at a particular river section. Because these flows are high, they commonly cause flooding further downstream. The word 'design' means that the hydrographs are not actual, but they are 'synthetic', or 'designed' by hydrologists using parameters obtained from past observations.
Further characteristic of a flood hydrograph is its return period (RP), which is related to its probability of exceedance in any given year (sometimes called Annual Exceedance Probability – AEP). For example, a flood hydrograph with a 10-year return period has the probability of exceedance of 0.1 in any given year. In other words, AEP = 1/RP. If the return period is higher, the probability of exceedance is lower, but the severity of such flood hydrograph (e.g. its maximum flow) is higher.
In Romania, flood risk analysis and management is carried out by National Administration "Romanian Waters", following the legislation according to the Flood Directive of the European Union. In the second cycle of flood risk assessment they used design flood hydrographs of 10 and 100 years return period, named 'F10' and 'F100'. They also used F100 flood hydrographs for the year 2050, under the influence of climate change, named 'F100CC', which for this region has 10% higher flows than the current F100.
These three design flood hydrographs are depicted on the figure to the right. Simulations of the flooding patterns in the Birda surroundings were performed with these hydrographs provided at the upstream boundary. Use the interface below to see the flood hazard KPI results under these different conditions.
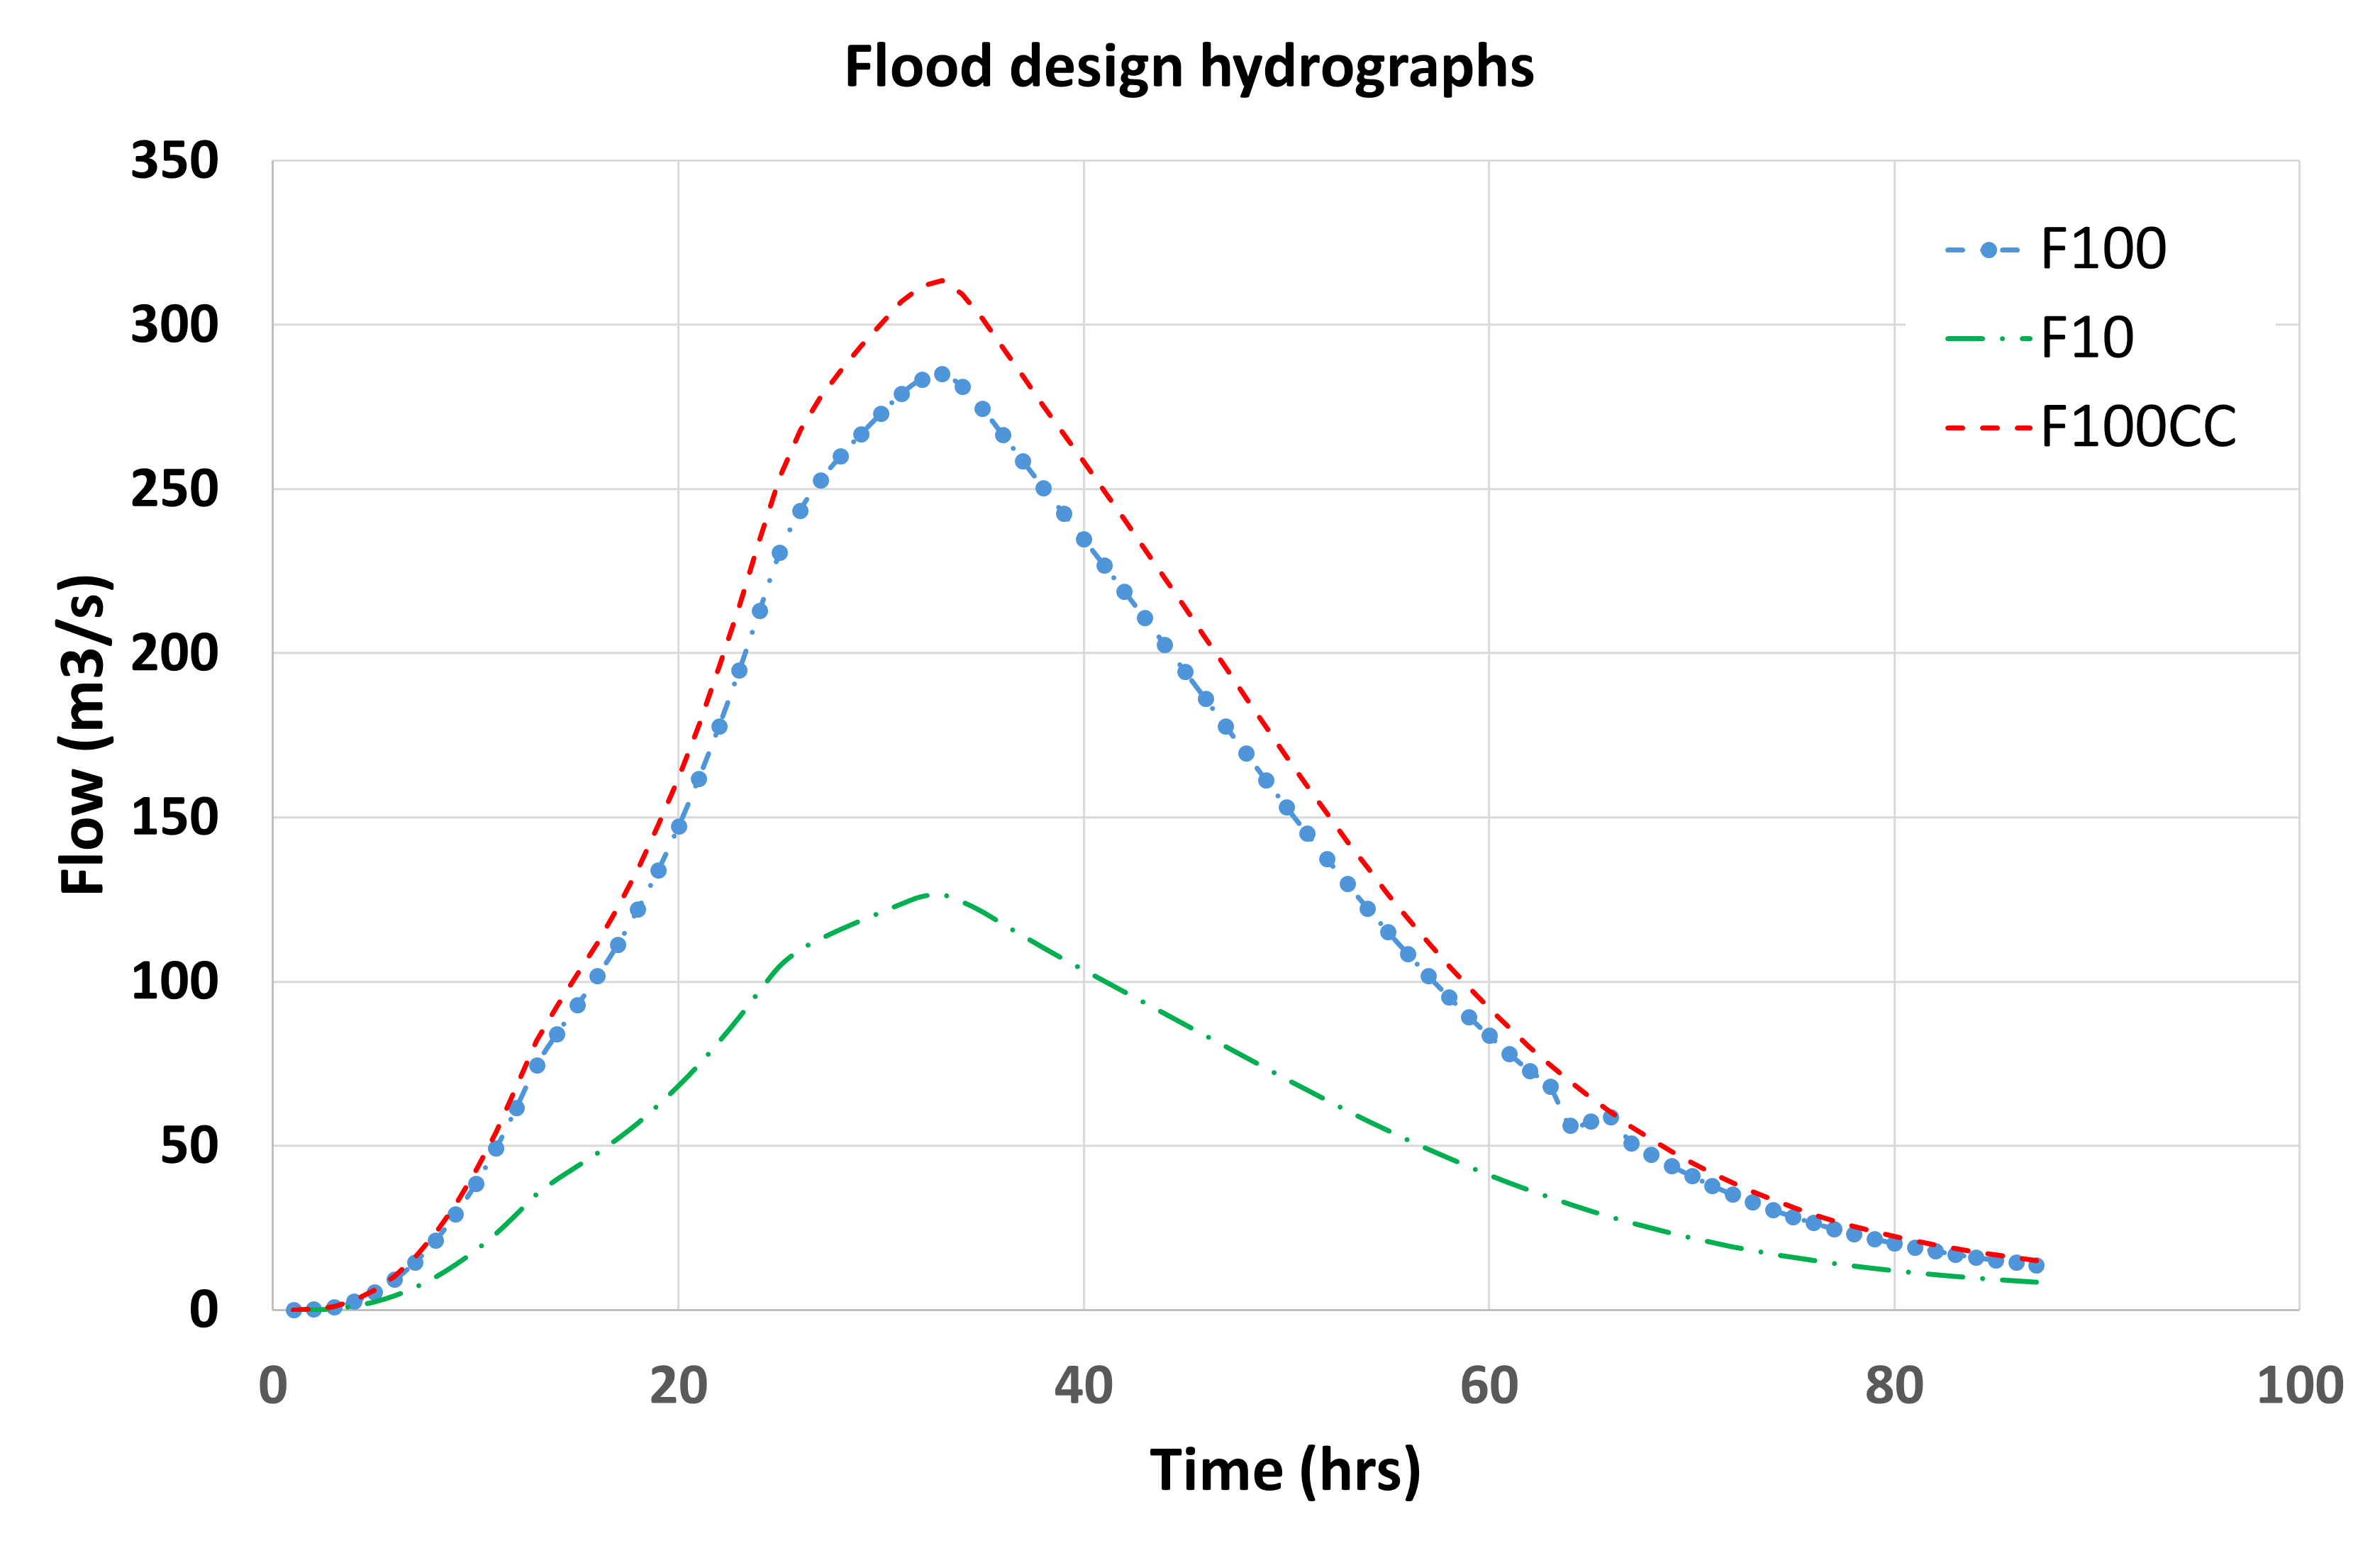
Design hydrographs for F10, F100, and F100CC scenarios at the upstream boundary