 English
 Română
 Nederlands
Westhoek Handzamevallei > Adaptation Strategies
The impacts of climate change are becoming more visible in many parts of the world. More frequent dry periods and heavier rainfall events can greatly impact agricultural landscapes and water systems. In face of new climatic conditions, it is necessary to plan, design and implement climate adaptation strategies that can help rural communities to better manage water-related risks and build resilience over long periods.
Adaptation strategies to cope with water surplus or water scarcity can take many forms. Some strategies focus on improvements on existing large concrete infrastructure (dams, dikes, weirs), while others rely on existing natural functions of the landscape and ecosystem services to reduce climate risks such as floods and droughts. The use of nature as an ally in adapting to climate change is central to Nature-based Solutions (NbS), one promising approach to enhance the overall landscape functioning and build community resilience.
Nature-based Solutions (NbS)
Nature-based Solutions (NbS) make use of the landscape and its natural processes to manage water in a more sustainable and flexible manner. NbS can help to slow down water when there is too much of it, store it in the landscape, and release it during drier periods when it is needed most. In this way, NbS can simultaneously contribute to reducing floods and alleviating drought impacts.
Beyond managing floods and droughts, NbS offer multiple benefits that make them especially valuable under a changing climate. While traditional grey infrastructure often lacks flexibility and addresses one specific problem, such as flood prevention, NbS can provide a more balanced approach. By restoring or creating natural areas, they can also improve water availability, support biodiversity, and create spaces for recreation or farming that are more aligned with a rural environment.
There are many different types of NbS (wetlands, infiltration ponds, ditch blocking), and "what works best where" depends on the existing landscape, its topography, soil, aquifer structure, land use and local needs. Because different NbS types can be distributed and combined across a catchment, they can have a cumulative effect, creating a strategy to make the whole area more resilient to water extremes.
NbS are not meant as a replacement for all forms of grey infrastructure — but they can complement and strengthen them, providing a more flexible and sustainable way to adapt to climate change. This flexibility makes NbS well aligned with the principles of adaptive water management, emphasizing learning by doing, adjusting measures to changing local conditions and reassessing strategies as new knowledge becomes available.
Click on each section below to learn more about different NbS types.
▶ Ditch Blocking
Description
Placing physical barriers in small drainage ditches connected to the main river network, delaying the amount of water reaching major watercourses located downstream.
Functioning
By blocking the flow of water in small ditches, the water is allowed to stay on the surface for longer, reducing flood peaks downstream, promoting infiltration and groundwater recharge.
Modelling Approach
Ditch blocking was simulated by adjusting the drain time constant (increasing it by 2/3 of the original value), to represent longer routing times of water from the drains to the river. The drain time constant is a model parameter that controls how quickly water is routed from the drainage system to the river.
▶ Wetlands
Description
Wetlands are areas where water remains near or above the surface for long periods. By retaining and storing water, creating conditions for special plants adapted to waterlogged soils to grow.
Functioning
Wetlands' main function is to retain and store water. By doing so, it allows vegetation to grow. Vegetation creates resistance to flow, reducing flood peaks, allowing more infiltration into the soil. Wetlands also support a wide range of fauna and flora, contributing to biodiversity.
Modelling Approach
The topography was lowered by 50 cm in the wetland area, vegetation was represented through the root depth and leaf area index model parameters set to mimic the characteristics of typical wetland plant species.
▶ Enhanced infiltration zones
Description
Enhanced infiltration zones represent areas with increased infiltration due to improved soil conditions, introduction of small ponds, and similar measures which would allow more water to infiltrate into the ground over time. These are not unique physical structures, but a modelling strategy to simulate healthier soils and local measures that favour infiltration.
Functioning
By promoting infiltration and allowing the water to be temporarily stored, enhanced infiltration zones can help to reduce flood peaks and recharge groundwater over time.
Modelling Approach
Enhanced infiltration zones were simulated by replacing the top soil (40 cm) with sand to enhance infiltration; vegetation in these zones was represented through the root depth and leaf area index model parameters set to mimic the characteristics of a grassland, reflected also in the roughness coefficient of these zones, and the detention storage was set to 15 cm.
Adaptation Strategies Implementation
To understand how Nature-based Solutions (NbS) can help manage water in the landscape, areas where NbS could potentially be implemented were first identified. This was done through an initial suitability map, the Doorgrondkaart Vlaanderen. From this map, the "orange" areas were selected. These indicate locations where rainwater can more easily soak into the ground and remain in the subsurface, due to favourable conditions such as good infiltration, a thick aquifer, and slightly higher elevation.
The area was then refined to better reflect real implementation potential. Areas with unsuitable land use (such as urban zones, forests, roads, and industrial areas) were removed. Zones with low infiltration capacity and areas where the Paniseliaan aquitard outcrops in the catchment were also removed. This resulted in a potential suitable area of approximately 32.4 km² for NbS implementation, which can be seen in Figure 1.
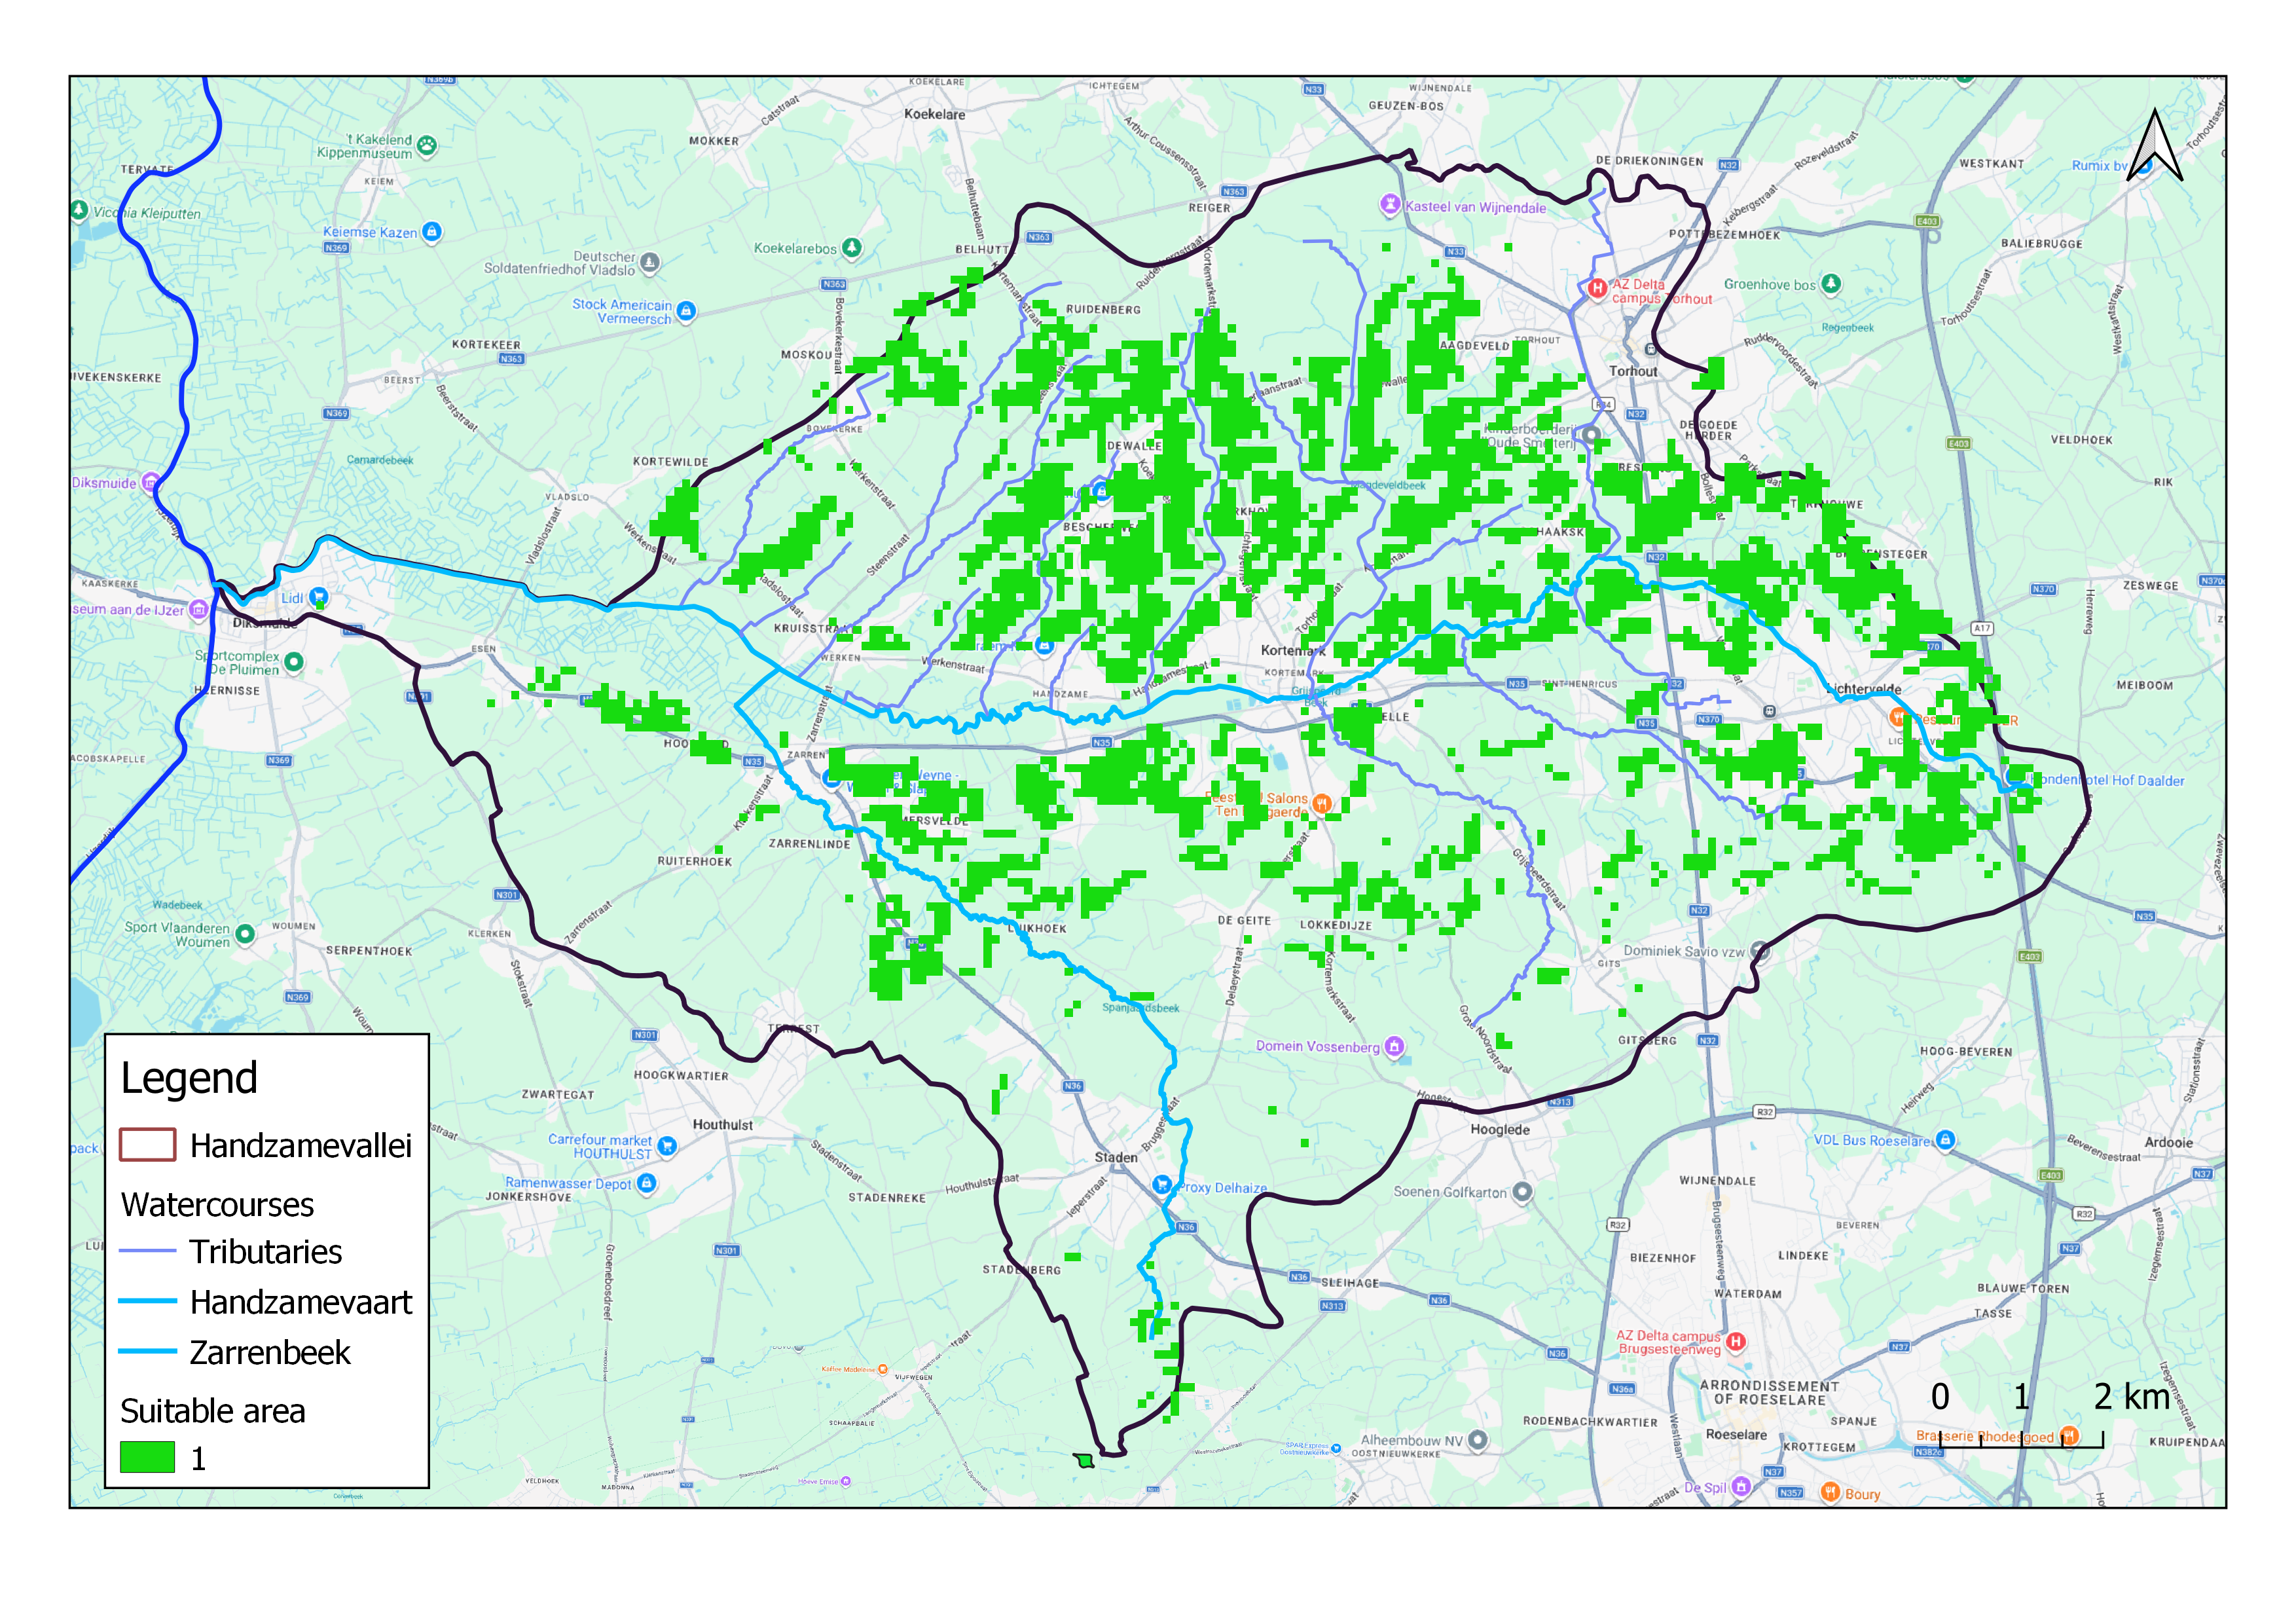
Figure: Potential areas for NbS implementation in the Handzamevaart catchment
Based on this potential area for implementation, wetlands and enhanced infiltration zones were modelled to explore how NbS could influence catchment hydrology (water storage, infiltration, river flows) under current climate conditions. One combined strategy was modelled in the Handzamevaart, with different levels of implementation across the catchment: starting upstream only, then extending to upstream and midstream, and finally applied across the entire catchment.
Combined strategy ▼ Expand
Placement of measures is based on simple criteria (thresholds) related to distance to rivers, groundwater depth, and slope, allowing a consistent and realistic distribution across the catchment.
Wetlands are placed in areas where water naturally tends to accumulate. These are typically flat (slope ≤ 2%), low-lying zones close to rivers (≤ 300 m from the rivers) with shallow groundwater levels (mean highest groundwater level ≤ 1.0 m below the ground), where it is easier for water to be stored temporarily, with no drainage.
Enhanced infiltration zones are placed in areas where water can be absorbed into the soil before reaching the river. These are generally higher areas (slope > 2%), further away from rivers (> 300 m from the rivers), with deeper groundwater levels (mean highest groundwater level > 1.0 m below the ground), where there is more space in the soil to store water.
Ditch blocking was applied across all drainage systems represented in the catchment by increasing the drainage time constant (i.e. by 2/3 of its original value), thereby slowing the routing of water through the drainage system to the river. This results in a delayed transfer of water to the river, allowing it to remain longer in the landscape and reducing rapid runoff.
Use the map-based interface below to explore the effects of the proposed adaptation strategies under current climate (2010-2019).
Strategy performance assessment
Use the map-based interface below to explore the effects of the proposed adaptation strategies under current climate (2010-2019). This interactive tool allows you to explore the effectiveness of different adaptation strategies on various Key Performance Indicators (KPIs). Select a strategy and a KPI to view the comparative analysis showing baseline conditions versus strategy implementation.
Strategy Performance Assessment
Use the map-based interface below to explore the effects of the proposed adaptation strategies under current climate (2010-2019). This interactive tool allows you to explore the effectiveness of different adaptation strategies on various Key Performance Indicators (KPIs). Select a strategy and a KPI to view the comparative analysis showing baseline conditions versus strategy implementation.